
585 relationships, 57 stopped behaving.
First reading, provisional: 168 pairs have no reading yet and are filled in next Saturday, so these figures can still move.
Every week we check how 585 pairs of markets stand to each other. This week no family stands out: the breaks are spread thin. Bonds have not joined in.
a normal Friday. Elevated: weeks this high come 21 in 100. Feb 2020 peaked at 21×, Oct 2008 at 14×.
0 of 7 families hot. A family is hot when three times as many of its pairs break as on a normal Friday.
Falling, 3.8× → 2.5×, sixth week above the Elevated line (2.1×). Last time it stood here on the way down: Jun 2026.
20 of 112 bond pairs breaking, where a normal Friday has 8. Credit: 0 of 28, normal 1.
Two ways to watch the ground move.
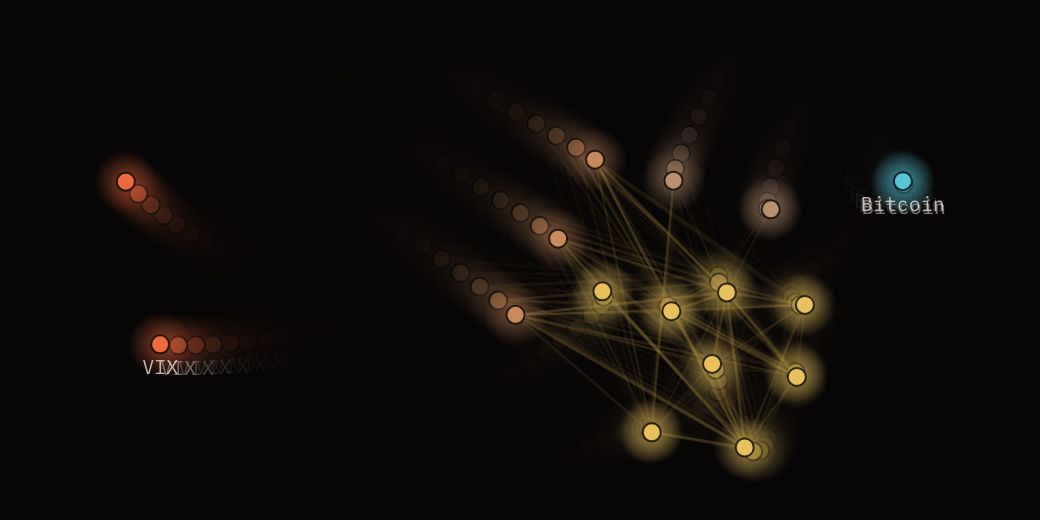 Correlation fieldThe market moving as one. Play the 2020 crash week by week and watch diversification fade as the field contracts to a single knot.Drill down ↗
Surfacing radar LiveThe board of the week ending 20 November 2026, as first published.Drill down ↗
Every instrument on one page, with the vol canary, an illustration of 2007–08.
RegimeRisk-on / Risk-offFear and greed in US shares, read two ways: how much fear is priced in, and how many shares take part, every Friday since 2010.Fear priced in: above normal (+0.81) · participation: very narrow (−1.68)This week’s reading ↗Where, which, and when before.
The week in full, as published every Saturday: every family, every pair that stopped behaving, and the episodes it compares with.
Ten relationships that stopped behaving.
- 01TAIEX — VIX (equity vol)A hedge working harder than usual: they move against each other more strongly.since 6 Nov · moved closer · correlation −0.89 · z +5.1
- 02S&P 500 — TAIEXMoving together even more closely than usual for this pair.since 13 Nov · moved closer · correlation 0.89 · z +4.5
- 03TAIEX ⟋ TIPS (TIP)Usually move together; now they move against each other.also last week · came apart · correlation −0.58 · z −4.2
- 04Nikkei 225 ⟋ SensexUsually move together; now they move against each other.also last week · came apart · correlation −0.50 · z −3.9
- 05Sensex ⟋ VIX (equity vol)Usually a hedge for each other; now they move together.also last week · came apart · correlation 0.40 · z −3.7
- 06Hang Seng — GoldMoving together even more closely than usual for this pair.also last week · moved closer · correlation 0.72 · z +3.6
- 07TAIEX ⟋ US 10y TreasuryUsually move together; now they move against each other.since 30 Oct · came apart · correlation −0.54 · z −3.6
- 08Sensex ⟋ TAIEXUsually move together; now they move against each other.also last week · came apart · correlation −0.54 · z −3.5
- 09Euro Stoxx 50 ⟋ TIPS (TIP)Usually move together; now they move against each other.since 13 Nov · came apart · correlation −0.56 · z −3.5
- 10S&P 500 ⟋ SensexUsually move together; now they move against each other.since 6 Nov · came apart · correlation −0.34 · z −3.5
Ten are listed above. The other 47 are marks in the field; the table holds all 57.
| Family | Pair | Direction | Correlation | z |
|---|---|---|---|---|
| Volatility | TAIEX — VIX (equity vol) | moved closer | −0.89 | +5.1 |
| Equity regions | S&P 500 — TAIEX | moved closer | 0.89 | +4.5 |
| Bonds | TAIEX ⟋ TIPS (TIP) | came apart | −0.58 | −4.2 |
| Equity regions | Nikkei 225 ⟋ Sensex | came apart | −0.50 | −3.9 |
| Volatility | Sensex ⟋ VIX (equity vol) | came apart | 0.40 | −3.7 |
| Commodities | Hang Seng — Gold | moved closer | 0.72 | +3.6 |
| Bonds | TAIEX ⟋ US 10y Treasury | came apart | −0.54 | −3.6 |
| Equity regions | Sensex ⟋ TAIEX | came apart | −0.54 | −3.5 |
| Bonds | Euro Stoxx 50 ⟋ TIPS (TIP) | came apart | −0.56 | −3.5 |
| Equity regions | S&P 500 ⟋ Sensex | came apart | −0.34 | −3.5 |
| Bonds | TSX ⟋ TIPS (TIP) | came apart | −0.33 | −3.2 |
| Equity regions | KOSPI ⟋ Sensex | came apart | −0.50 | −3.2 |
| Commodities | S&P 500 — Copper | moved closer | 0.83 | +3.2 |
| Bonds | TAIEX ⟋ Intl bonds (BNDX) | came apart | −0.46 | −3.0 |
| Commodities | TAIEX — Copper | moved closer | 0.71 | +3.0 |
| Volatility | EM (EEM) — VIX (equity vol) | moved closer | −0.89 | +2.9 |
| Commodities | US Financials ⟋ Gold | came apart | 0.50 | −2.8 |
| Commodities | Sensex ⟋ Copper | came apart | −0.32 | −2.8 |
| Bonds | FTSE 100 ⟋ TIPS (TIP) | came apart | −0.26 | −2.8 |
| Commodities | World (ACWI) — Copper | moved closer | 0.83 | +2.8 |
| Bonds | Nikkei 225 ⟋ TIPS (TIP) | came apart | −0.52 | −2.7 |
| Bonds | KOSPI ⟋ TIPS (TIP) | came apart | −0.43 | −2.7 |
| Volatility | US Tech ⟋ MOVE (bond vol) | came apart | −0.11 | −2.7 |
| Commodities | Hang Seng — Silver | moved closer | 0.60 | +2.6 |
| Bonds | EM (EEM) ⟋ TIPS (TIP) | came apart | −0.51 | −2.6 |
| Equity regions | ASX 200 — TSX | moved closer | 0.86 | +2.5 |
| Equity regions | Euro Stoxx 50 — TAIEX | moved closer | 0.75 | +2.5 |
| Bonds | Jakarta ⟋ TIPS (TIP) | came apart | −0.40 | −2.5 |
| Commodities | ASX 200 — Gold | moved closer | 0.63 | +2.5 |
| Commodities | Tadawul ⟋ Natural gas | came apart | 0.47 | −2.5 |
| Commodities | US Tech — Copper | moved closer | 0.74 | +2.4 |
| FX and crypto | Nikkei 225 ⟋ Swiss franc vs USD | came apart | −0.44 | −2.4 |
| Bonds | S&P 500 ⟋ TIPS (TIP) | came apart | −0.50 | −2.4 |
| Bonds | Tadawul ⟋ TIPS (TIP) | came apart | −0.40 | −2.4 |
| Bonds | US Real estate ⟋ TIPS (TIP) | came apart | −0.04 | −2.4 |
| Equity regions | S&P 500 — Euro Stoxx 50 | moved closer | 0.85 | +2.4 |
| Bonds | Shanghai ⟋ TIPS (TIP) | came apart | −0.34 | −2.4 |
| Bonds | US Industrials ⟋ TIPS (TIP) | came apart | −0.50 | −2.3 |
| Equity regions | TSX — TAIEX | moved closer | 0.69 | +2.3 |
| Commodities | TSX — Copper | moved closer | 0.80 | +2.3 |
| Bonds | World (ACWI) ⟋ TIPS (TIP) | came apart | −0.49 | −2.3 |
| Volatility | World (ACWI) ⟋ MOVE (bond vol) | came apart | −0.26 | −2.3 |
| Commodities | Shanghai — Silver | moved closer | 0.72 | +2.3 |
| Equity regions | Euro Stoxx 50 — ASX 200 | moved closer | 0.79 | +2.3 |
| Commodities | Sensex ⟋ Natural gas | came apart | 0.23 | −2.3 |
| Commodities | ASX 200 — Copper | moved closer | 0.66 | +2.3 |
| Bonds | KOSPI ⟋ US 10y Treasury | came apart | −0.48 | −2.2 |
| Volatility | S&P 500 ⟋ MOVE (bond vol) | came apart | −0.24 | −2.2 |
| Commodities | US Financials — Copper | moved closer | 0.64 | +2.2 |
| Equity regions | FTSE 100 — TAIEX | moved closer | 0.59 | +2.2 |
| Volatility | US Tech — VIX (equity vol) | moved closer | −0.89 | +2.1 |
| Bonds | US Tech ⟋ TIPS (TIP) | came apart | −0.51 | −2.1 |
| Equity regions | Euro Stoxx 50 ⟋ Sensex | came apart | −0.01 | −2.1 |
| Bonds | Jakarta ⟋ US 10y Treasury | came apart | −0.34 | −2.1 |
| US sectors | US Financials — US Health | moved closer | 0.70 | +2.1 |
| Bonds | ASX 200 ⟋ TIPS (TIP) | came apart | −0.18 | −2.0 |
| Equity regions | Sensex ⟋ TSX | came apart | −0.05 | −2.0 |
Three times before. Friday by Friday, from the week each one crossed.
One square lighter.
What moved in seven days, and what didn't.
- Severity, against a normal Friday
- 3.8× → 2.5×
- Pairs behaving unlike their past
- 82 → 57
- Families hot
- 2 of 7 → 0 of 7 · Equity regions left, Volatility left
- New on the list
- 32 pairs · TSX ⟋ TIPS (TIP) among them
- Reach into bonds
- 20 of 112 → 20 of 112 · not yet
Is the ground moving? Tremor Watch in a minute and a half.
A seismograph can’t tell you when the next earthquake will come; it tells you whether the ground is moving. Tremor Watch does that for markets, whose ground is their relationships: every week it counts the ones that stopped behaving like their own past two years, with a reading for every week since 1997.
1 min 26 s · in English, with captions · The pictures are illustrations; the index since 1997 is the real reading · Descriptive, not a forecast.
This is the reading for the week ending 20 November 2026, kept as first published.
This week’s reading →
api.antevo.ch/v1/public/tremor, and every pair of a week: api.antevo.ch/v1/public/tremor/pairs. Or as a spreadsheet: history.csv, one row for every Friday. Earlier weeks are restated when late data arrives; each week’s own page keeps the figure as first published.
One email each Saturday with the week’s reading. Stop any time. Privacy policy
Check your inbox to confirm.Check the address and try again.Too many tries just now. Try again later.That did not go through. Try again in a minute.753 pairs in seven families, each family weighing the same · correlation of weekly returns, weighted to the last few months (half-life nine weeks), Friday to Friday · a pair breaks when that correlation is two standard deviations away from its own previous two years (Fisher z, spread floored at sampling noise) · Calm, Elevated, High and Severe are the 75th, 90th and 97th percentiles of every week since 2001 · a normal Friday is the median week since 2001 · derived statistics only, no prices · since 1997, recomputed each week, the first published value kept.